Introduction
When you receive a forex signal especially in a fast-moving market your instinct might be to act immediately. But the smartest traders know how to analyze a signal before acting, taking time to pause, assess, and execute with intention. In this case study-style guide, we’ll walk through a real-time signal breakdown step by step, showing you how to evaluate a trade idea before jumping in.
This is your blueprint for turning signals into confident, informed decisions not just reactions.
Step 1: The Signal Comes In
Let’s say it’s Thursday morning and you receive this signal from SignalsGrid:
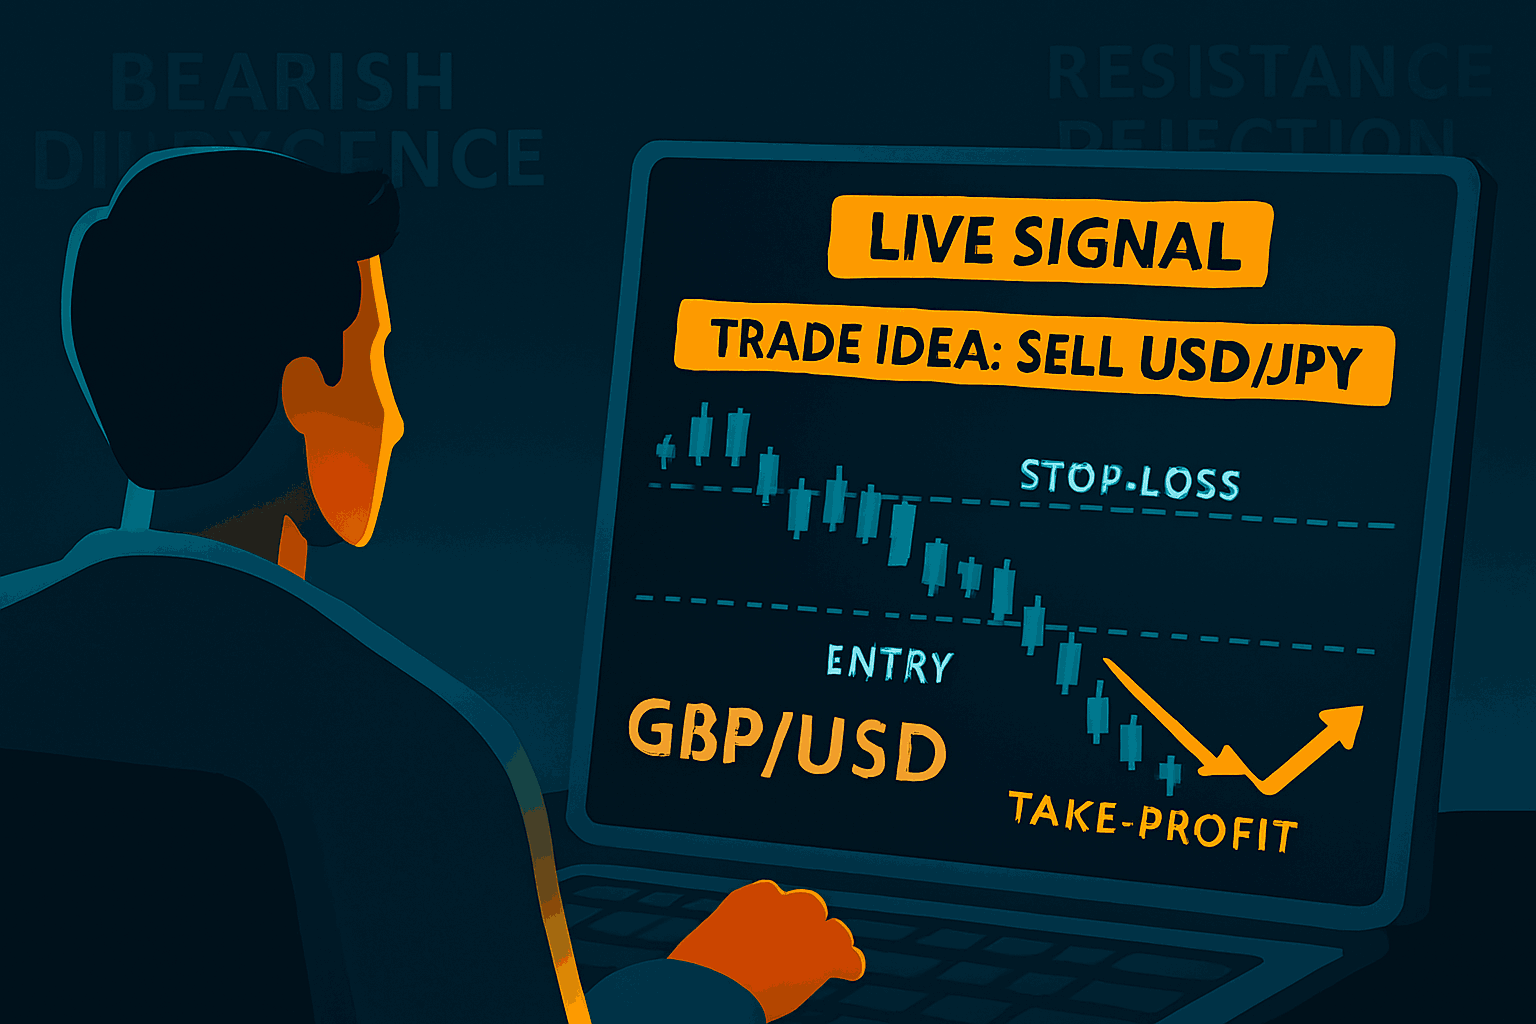
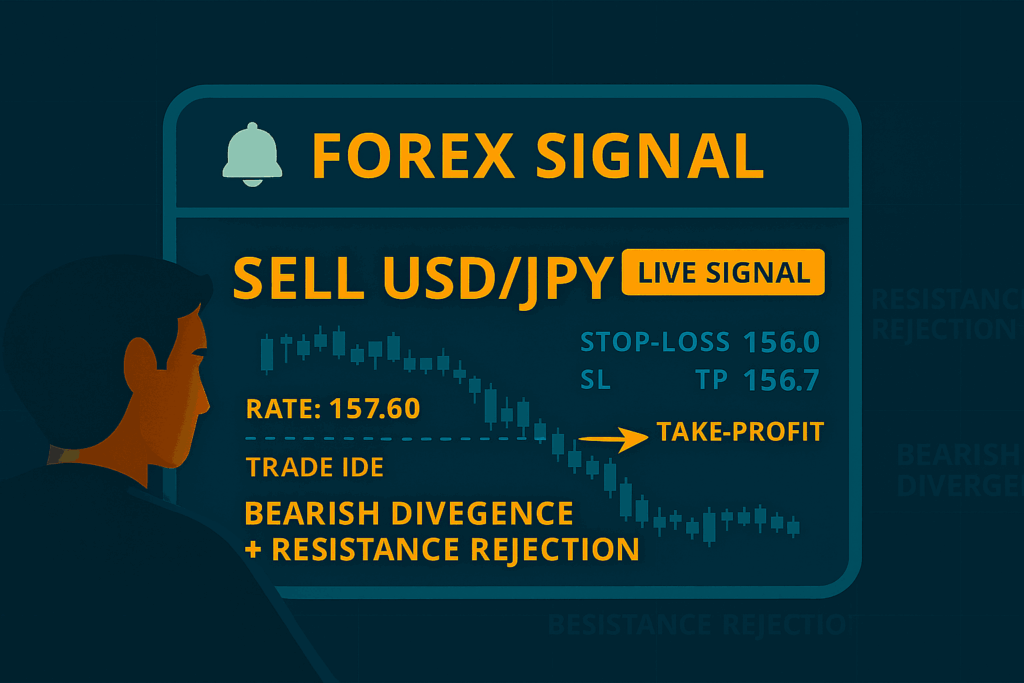
PAIR: USD/JPY
ACTION: SELL
ENTRY: 157.60
STOP-LOSS: 158.20
TAKE-PROFIT: 156.50
STRATEGY: Bearish Divergence + Resistance Rejection
CONFIDENCE: 🔸 High
You could just copy-paste the trade but let’s do it the smart way and analyze before acting.
Step 2: Check the Chart
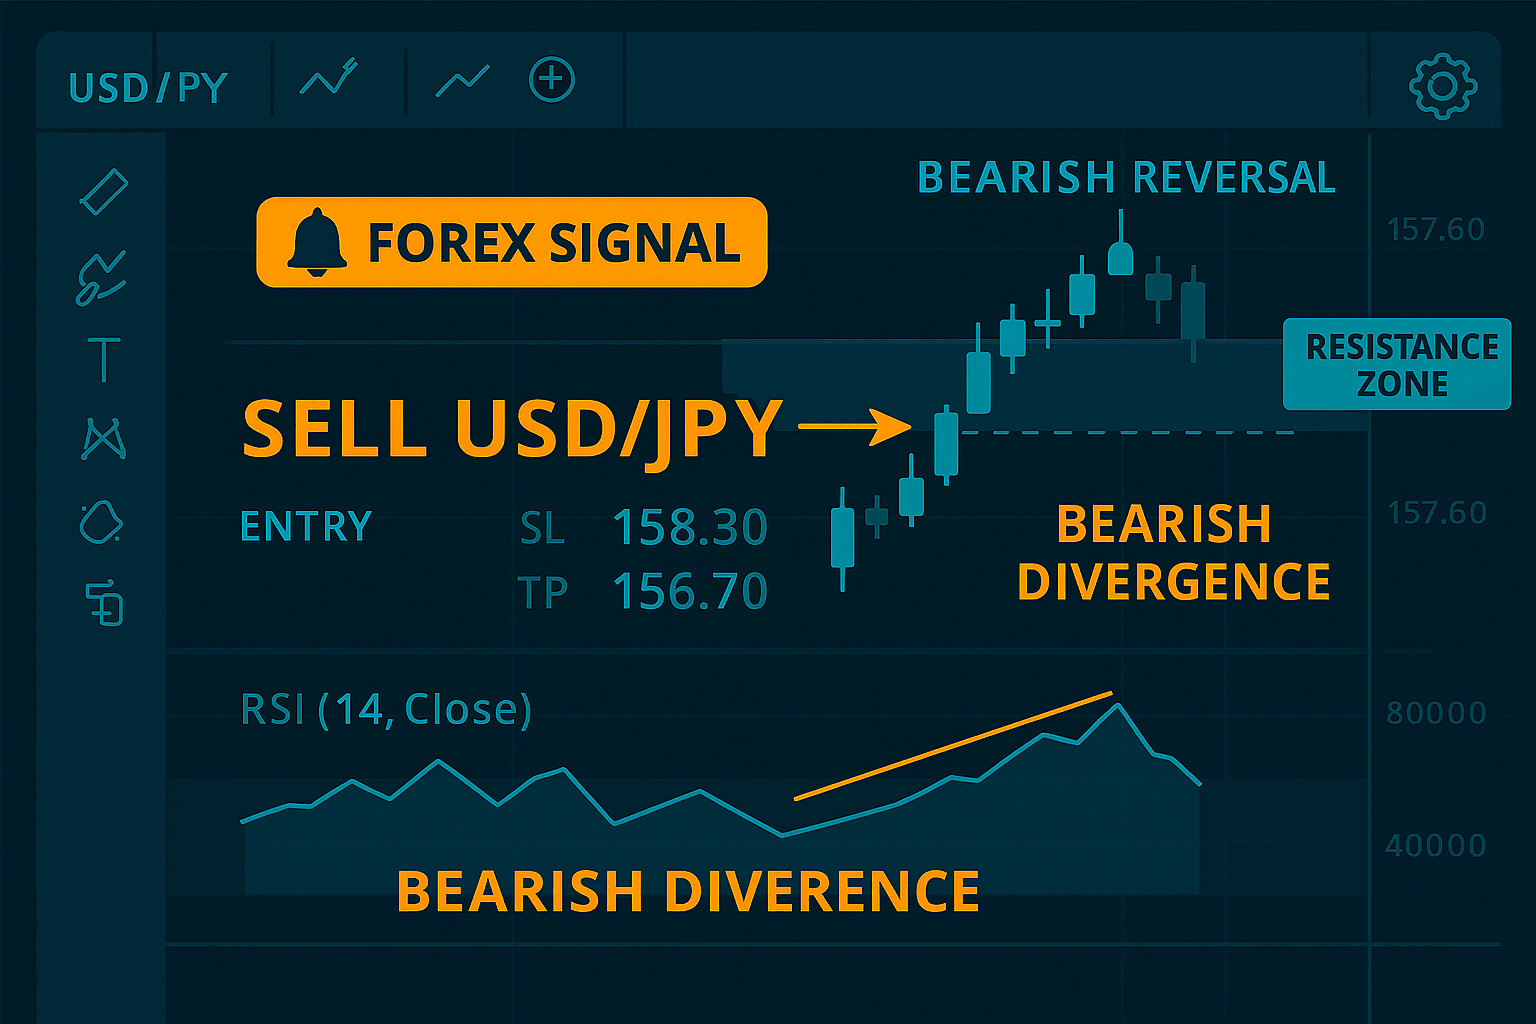
Open your trading platform and look at USD/JPY on the 1H or 4H chart.
Here’s what you want to confirm:
- Is price near 157.60 now? (Don’t enter too late or early)
- Is there clear resistance in that zone?
- Can you see the bearish divergence between price and RSI or MACD?
- Did a reversal candle just form (e.g., shooting star, engulfing)?
If all signs match, it means the signal was technically valid. ✅
If price is far from 157.60 already, the signal might be expired or less favorable. ❌
Step 3: Recalculate Risk
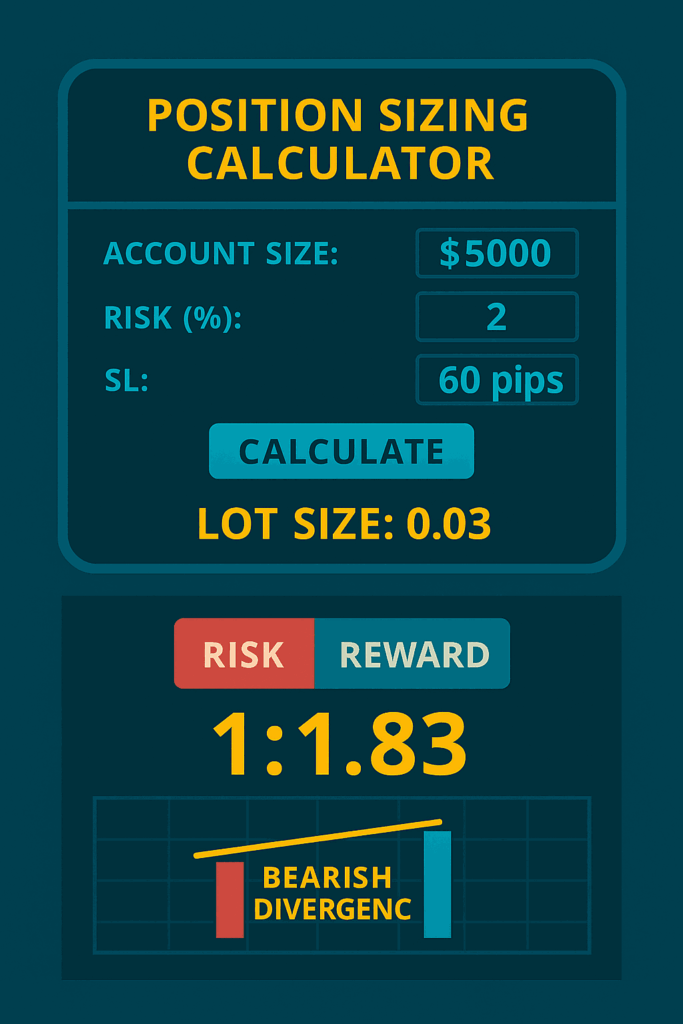
Let’s say your account is $5,000, and you risk 2% per trade.
- Risk Amount: $100
- SL Distance: 60 pips
- Position Size: Use a calculator → approx. 0.17 lots (micro-adjustable depending on broker)
Confirm that the lot size you’re about to use aligns with your plan.
Also ask: Is the RRR good?
- You’re risking 60 pips to gain 110 = ~1:1.83
- That’s within a healthy range for a reversal setup
Step 4: Check the News
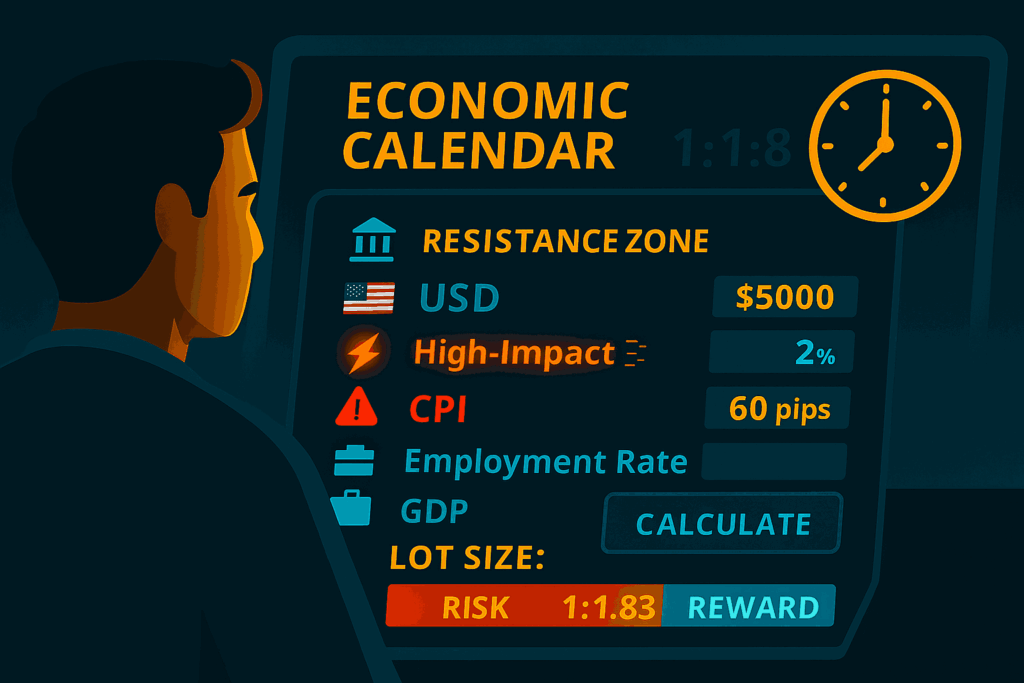
Go to your economic calendar. Is there high-impact JPY or USD news coming in the next 30–60 minutes?
- If yes: maybe wait or reduce position size
- If no: proceed with confidence
Sometimes news spikes invalidate technical so this step is critical.
Step 5: Execution Plan
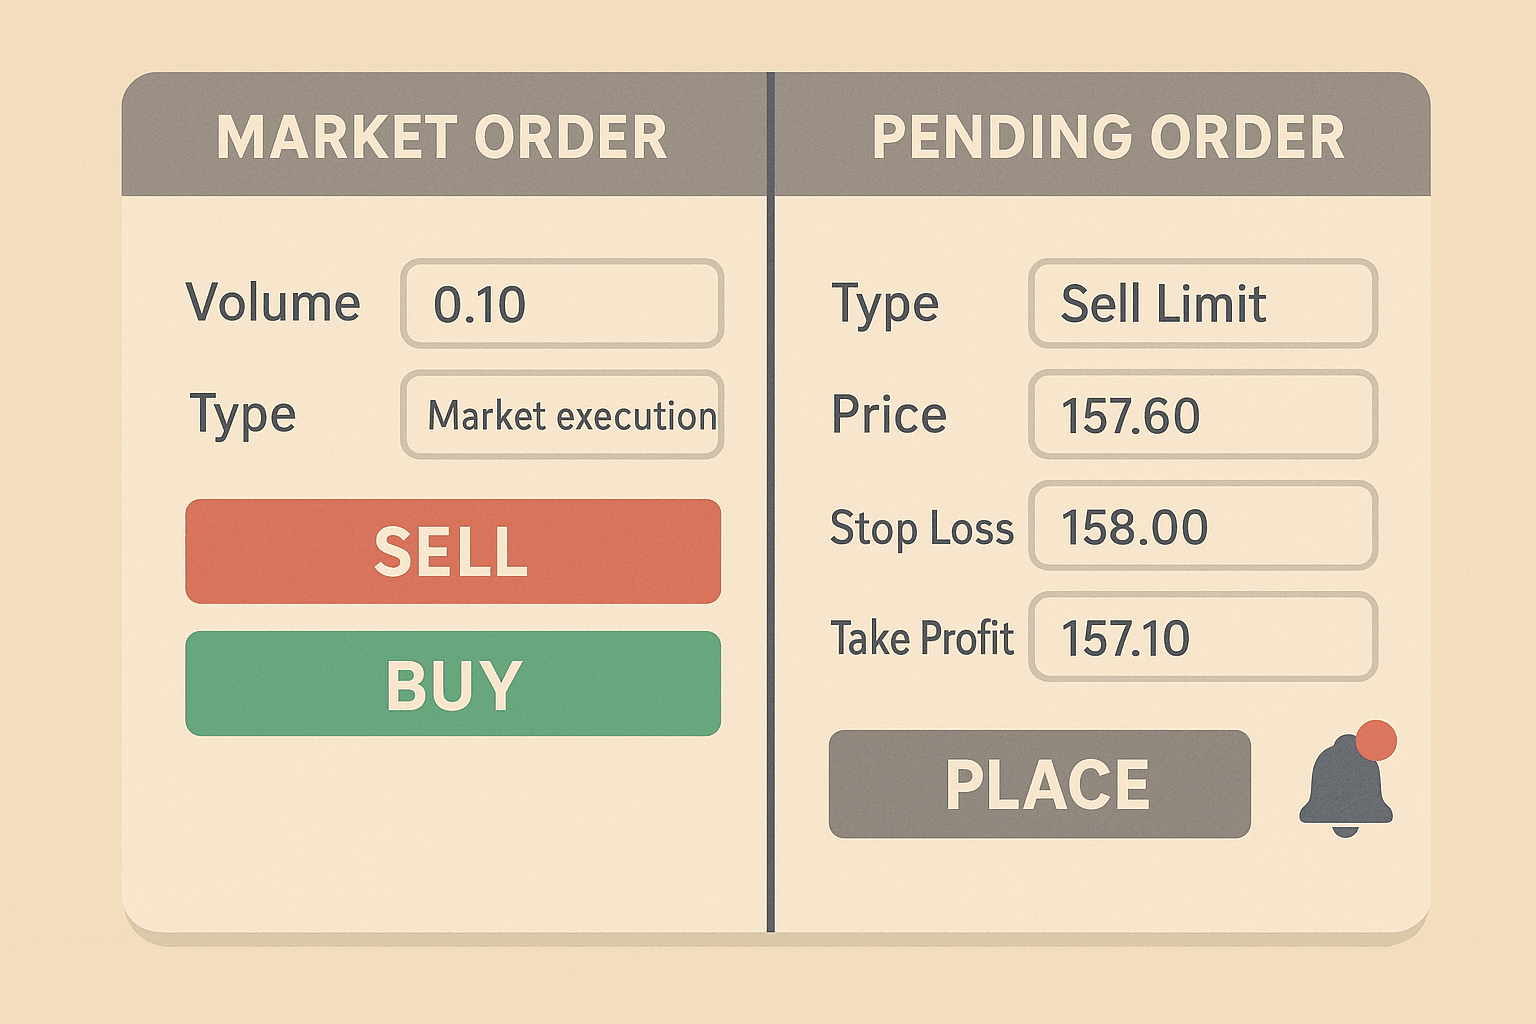
Now that the setup looks clean and risk is controlled, decide how you’ll enter:
- Manual Entry: Place order at market if price is near 157.60
- Pending Order: Use a sell limit order if price hasn’t hit 157.60 yet
- Stop-Loss & TP: Set them immediately after entry
Tip: Use alerts in case you want to monitor before committing.
Step 6: Post-Trade Mindset
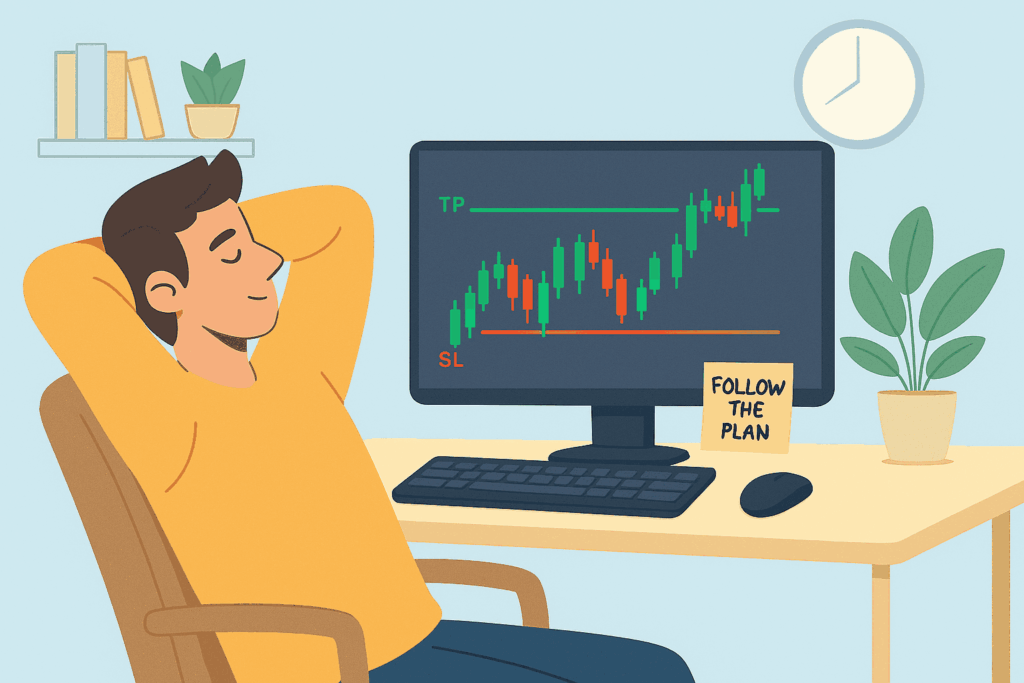
Once the trade is live, don’t interfere:
- No dragging the SL unless your plan says so
- No exiting early unless major news hits
- Let the signal play out
This is where discipline beats doubt.
What This Breakdown Teaches You
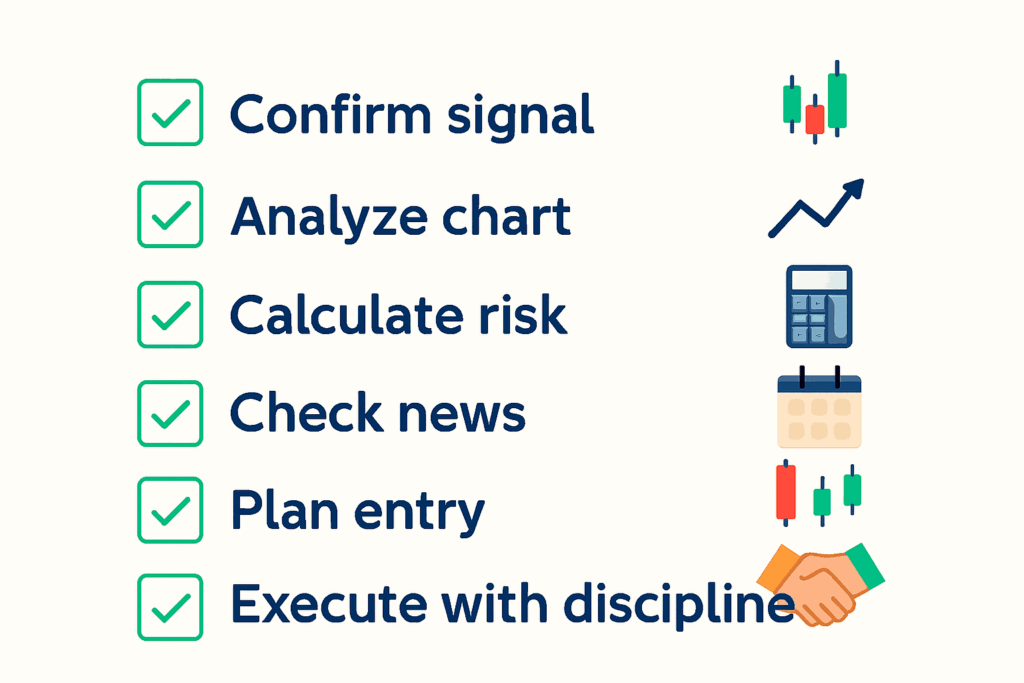
By following this real-time analysis flow, you:
- Trade with logic, not emotion
- Confirm signal validity on your chart
- Stay in control of risk
- Avoid chasing expired signals
- Build a routine you can repeat consistently
Final Thoughts
Not every signal requires action but every signal deserves evaluation. When you pause to analyze before entering, you separate yourself from the crowd and move one step closer to professional-level execution.
At SignalsGrid, we give you the tools clear entries, structured SL/TP, and strategy tags. But your edge comes from how you apply them.
Next time a signal drops, don’t just trade it. Break it down. Own the setup. Then act with precision.